I recently came across this interesting info-graphic. It is a couple of years old now and does not apply to Washington State. It mentions how different states look at determining a reasonable amount of power generation that can come from net metered solar, and uses examples of 15%, 25% (Hawaii), or 50% (California) and different thresholds to use as a basis for those percentages.
Here in Washington State, utilities are only required to allow 0.5% of the 1996 peak load – such a low threshold it is ridiculously limiting. Thankfully the utilities in which we have surpassed this threshold have seen no problems with allowing additional net metering systems. In the coming months we will be working closely with our legislators to address this archaic and potentially stifling limitation before it negatively affects our clients and our community.
Enjoy this explanatory graphic:
http://ilsr.org/archiac-utility-rules-stall-local-solar-infographic/
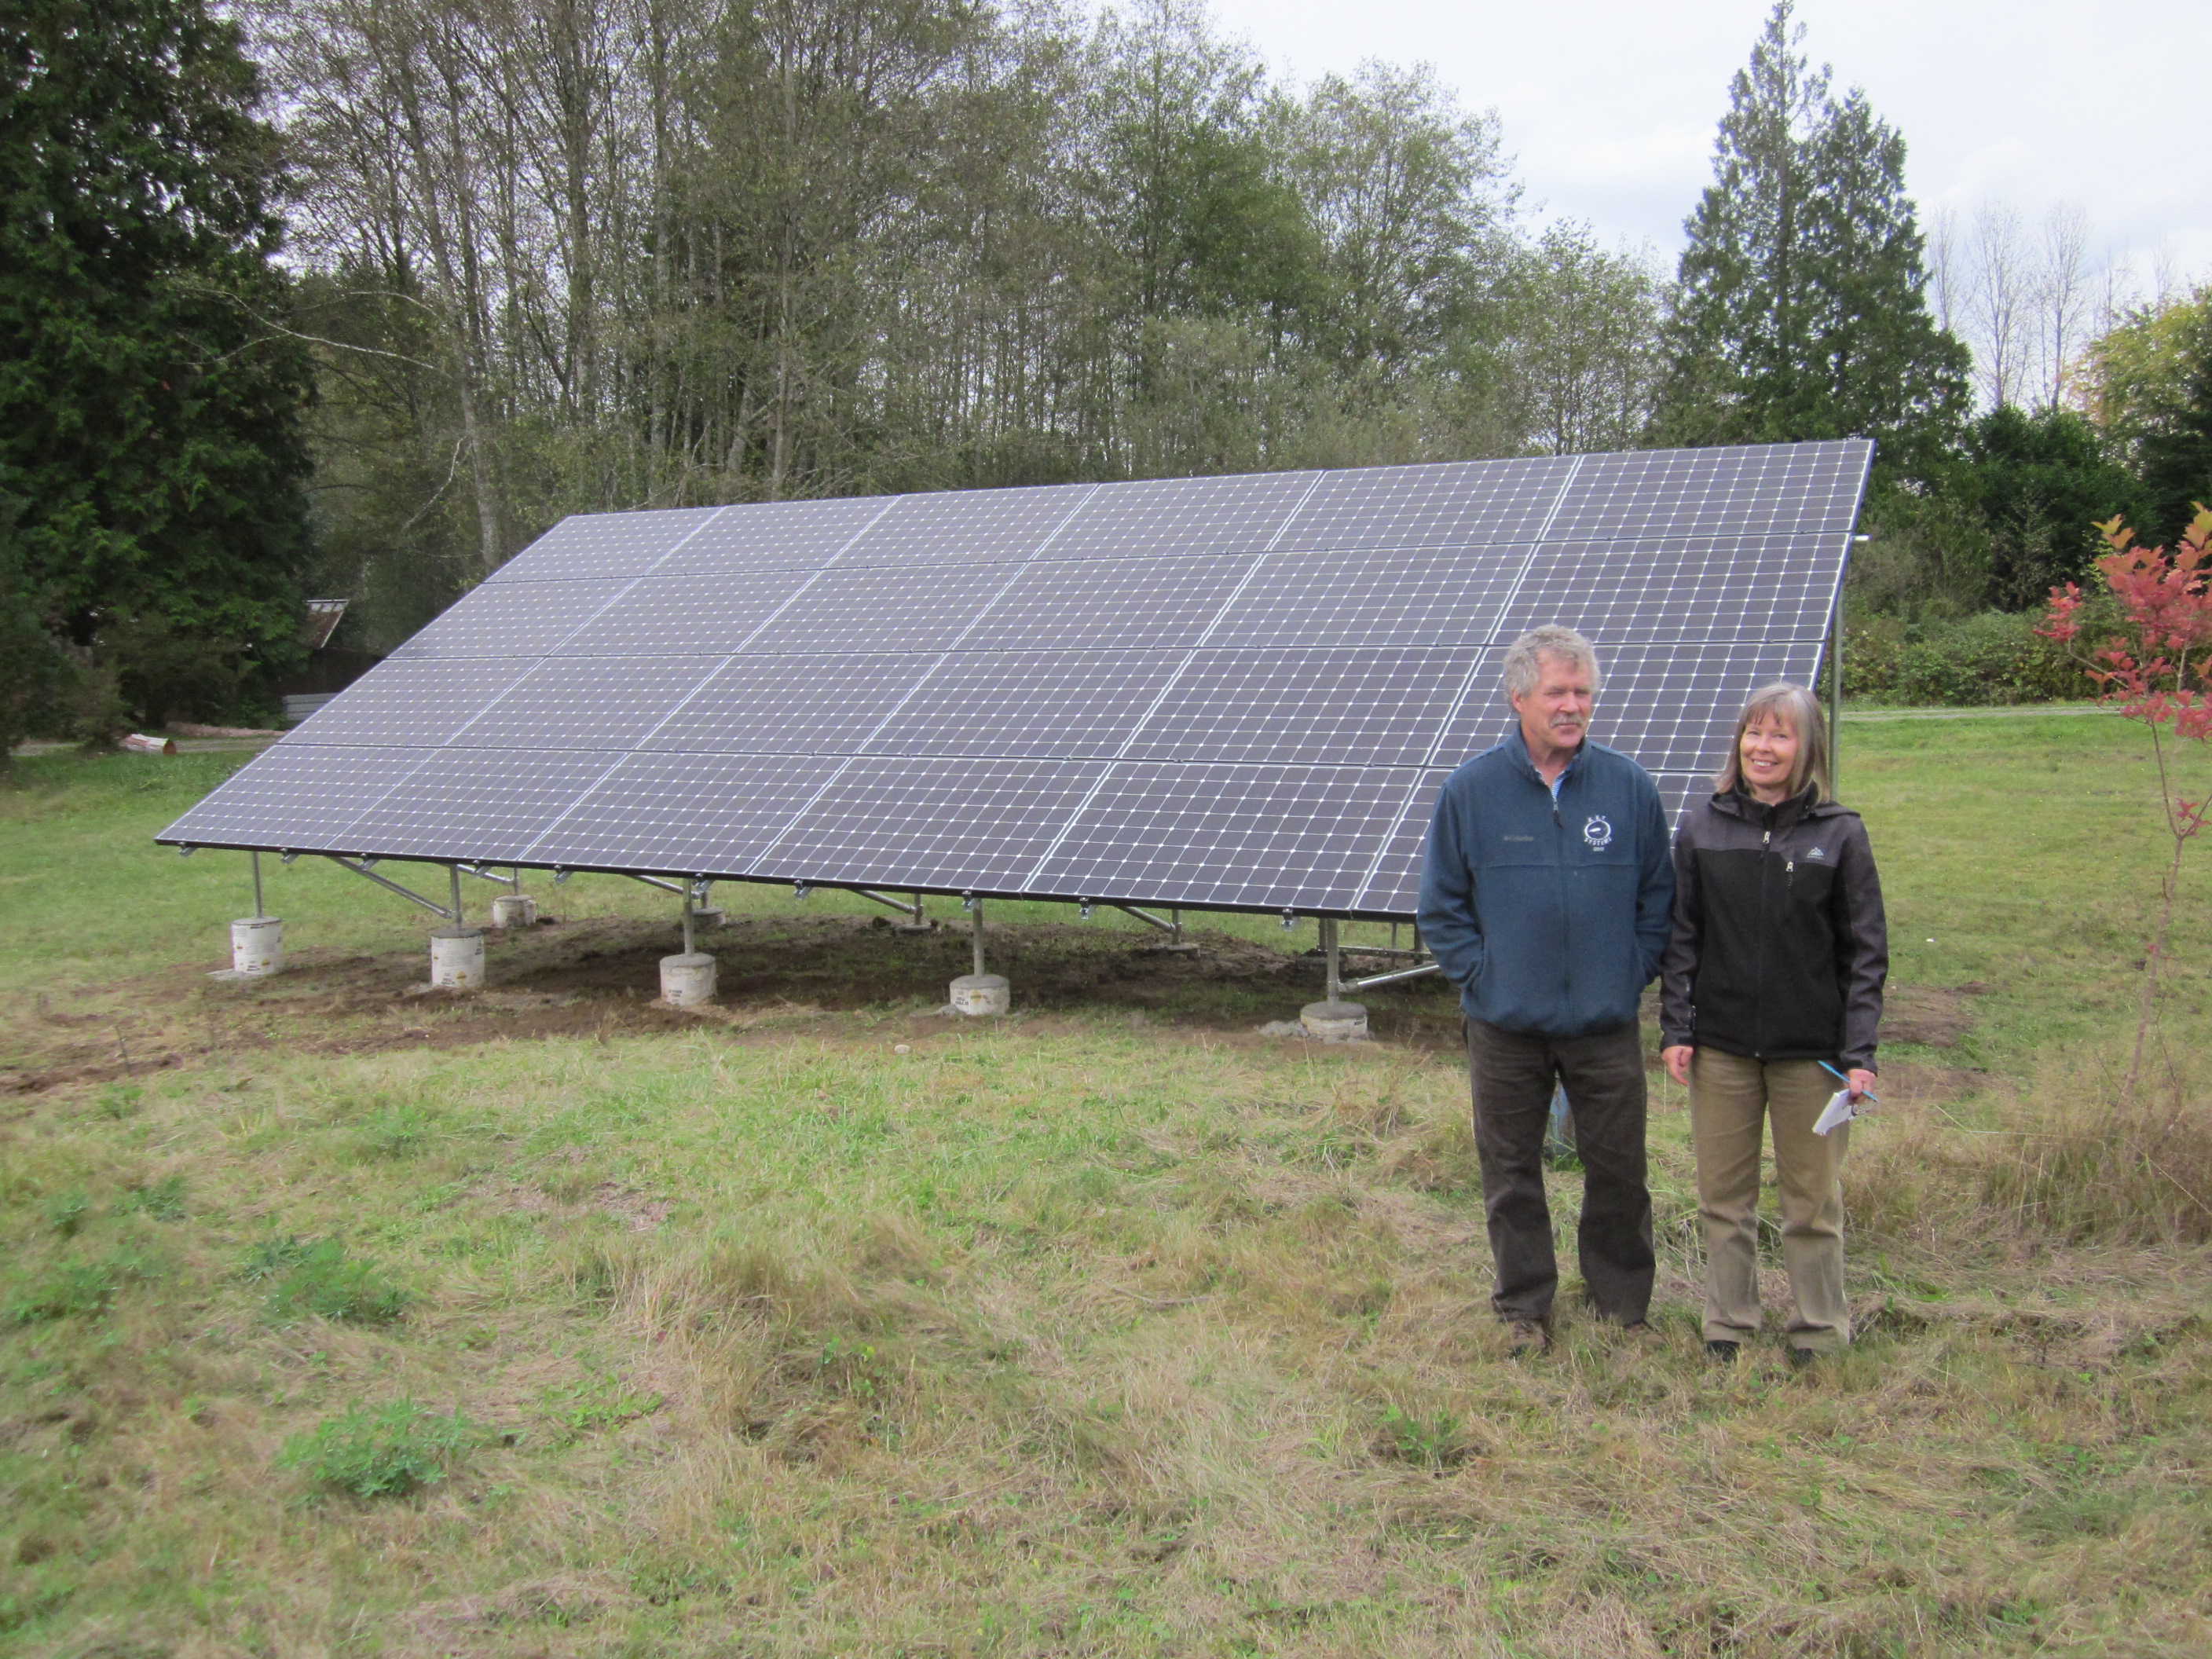
Another beautiful ground mounted array for beautiful people in Poulsbo, October 2014.
I see the graphic link not working at the moment, I will attempt to re-link or find a .jpg of that graphic.