Here at Power Trip Energy, we are in the same situation as everybody else – concerned for the health of our employees, families, clients, and community. We are reading the news, reacting to event closures, and making sure everyone performs the best safest practices to prevent illness in ourselves and others. Immediately relevant is the cancellation of two home shows this weekend, and since cancellation was was not required, and because it surely represents a loss of revenue and time spent, we appreciate these decisions being made by KONP in Port Angeles and the Kitsap Builders Association. It is not the right time to conduct an event like a home show.
Since the nature of our work is generally outdoors, we are thankful to be proceeding with solar installations on regular schedule, while in the office, we are being especially clean and considerate of each other.
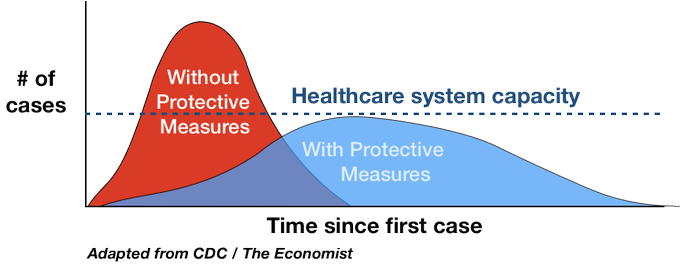
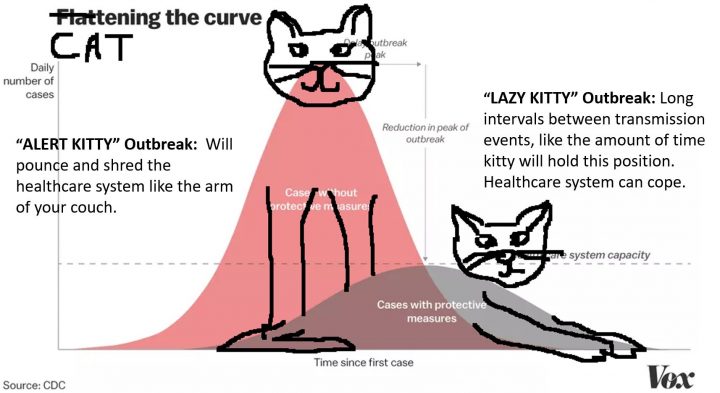
I love graphs, so I want to share a couple you have probably seen, which help me to understand the nature of the challenge ahead of us. In regards to statistically tracking what is known about the virus in the US, the Center for Disease Control site is simple and helpful. As of Friday March 13, yes, it appears we are on the upward curve as predicted. Check the bar graph titled “COVID-19 Cases in the United States by date of illness onset, January 12, 2020 to March 12, 2020 at 4pm ET (n=792)**” at https://www.cdc.gov/coronavirus/2019-ncov/cases-in-us.html


