Federal Solar Incentives
Since 2006, we have had a very generous Federal Tax Credit for solar photovoltaic equipment – a 30% Investment Tax Credit. For most of our clients this is a straight-forward tax credit taken on Form 5695 for individuals and Form 3468 for businesses.
While many people hold the opinion that the Federal government needs to do more to support renewable energy, we feel that a 30% tax credit is generous. The improvement we would wish for federal energy policy would be to remove the myriad explicit and hidden subsidies for the standard centralized and polluting energy sources.
This solar tax credit expires in 2016, and we see little chance of it’s extension. So this 2016 date is a good deadline for you to install solar if you are unable to do so immediately.
For businesses, there are also special depreciation rules which can help decrease your tax burden, however these seem to change every year and during the year, so please consult your tax professional regarding depreciation of solar energy systems for your business.
SEIA maintains a good explanatory web page here: www.seia.org/policy/finance-tax/solar-investment-tax-credit
The primary IRS site for residential solar tax credits: www.irs.gov/uac/Form-5695,-Residential-Energy-Credits
The primary IRS site for commercial solar tax credits: www.irs.gov/uac/Form-3468,-Investment-Credit-2
Time to Read Your Production Meters
If you have a grid-tied pv system and are enrolled in Washington State’s Renerwable Energy Production Incentive, it is time to make some notes for yourself. The 2013-2014 production metering year ends on Monday, June 30th, and the 2014-2015 production year starts Tuesday, July 1st.
Many of you know the process, but for many new customers, this will be your first production payment.
Different utilities handle this metering and payment in different ways. Some of them will take the meter readings themselves (eg PSE and Jefferson PUD), and some may rely upon you to report this reading (eg Clallam PUD). In either case, we recommend that you also take this reading and keep track of it in order to verify correct payment. If you have the record of payment you received from last year, this may be the best place to write it down.
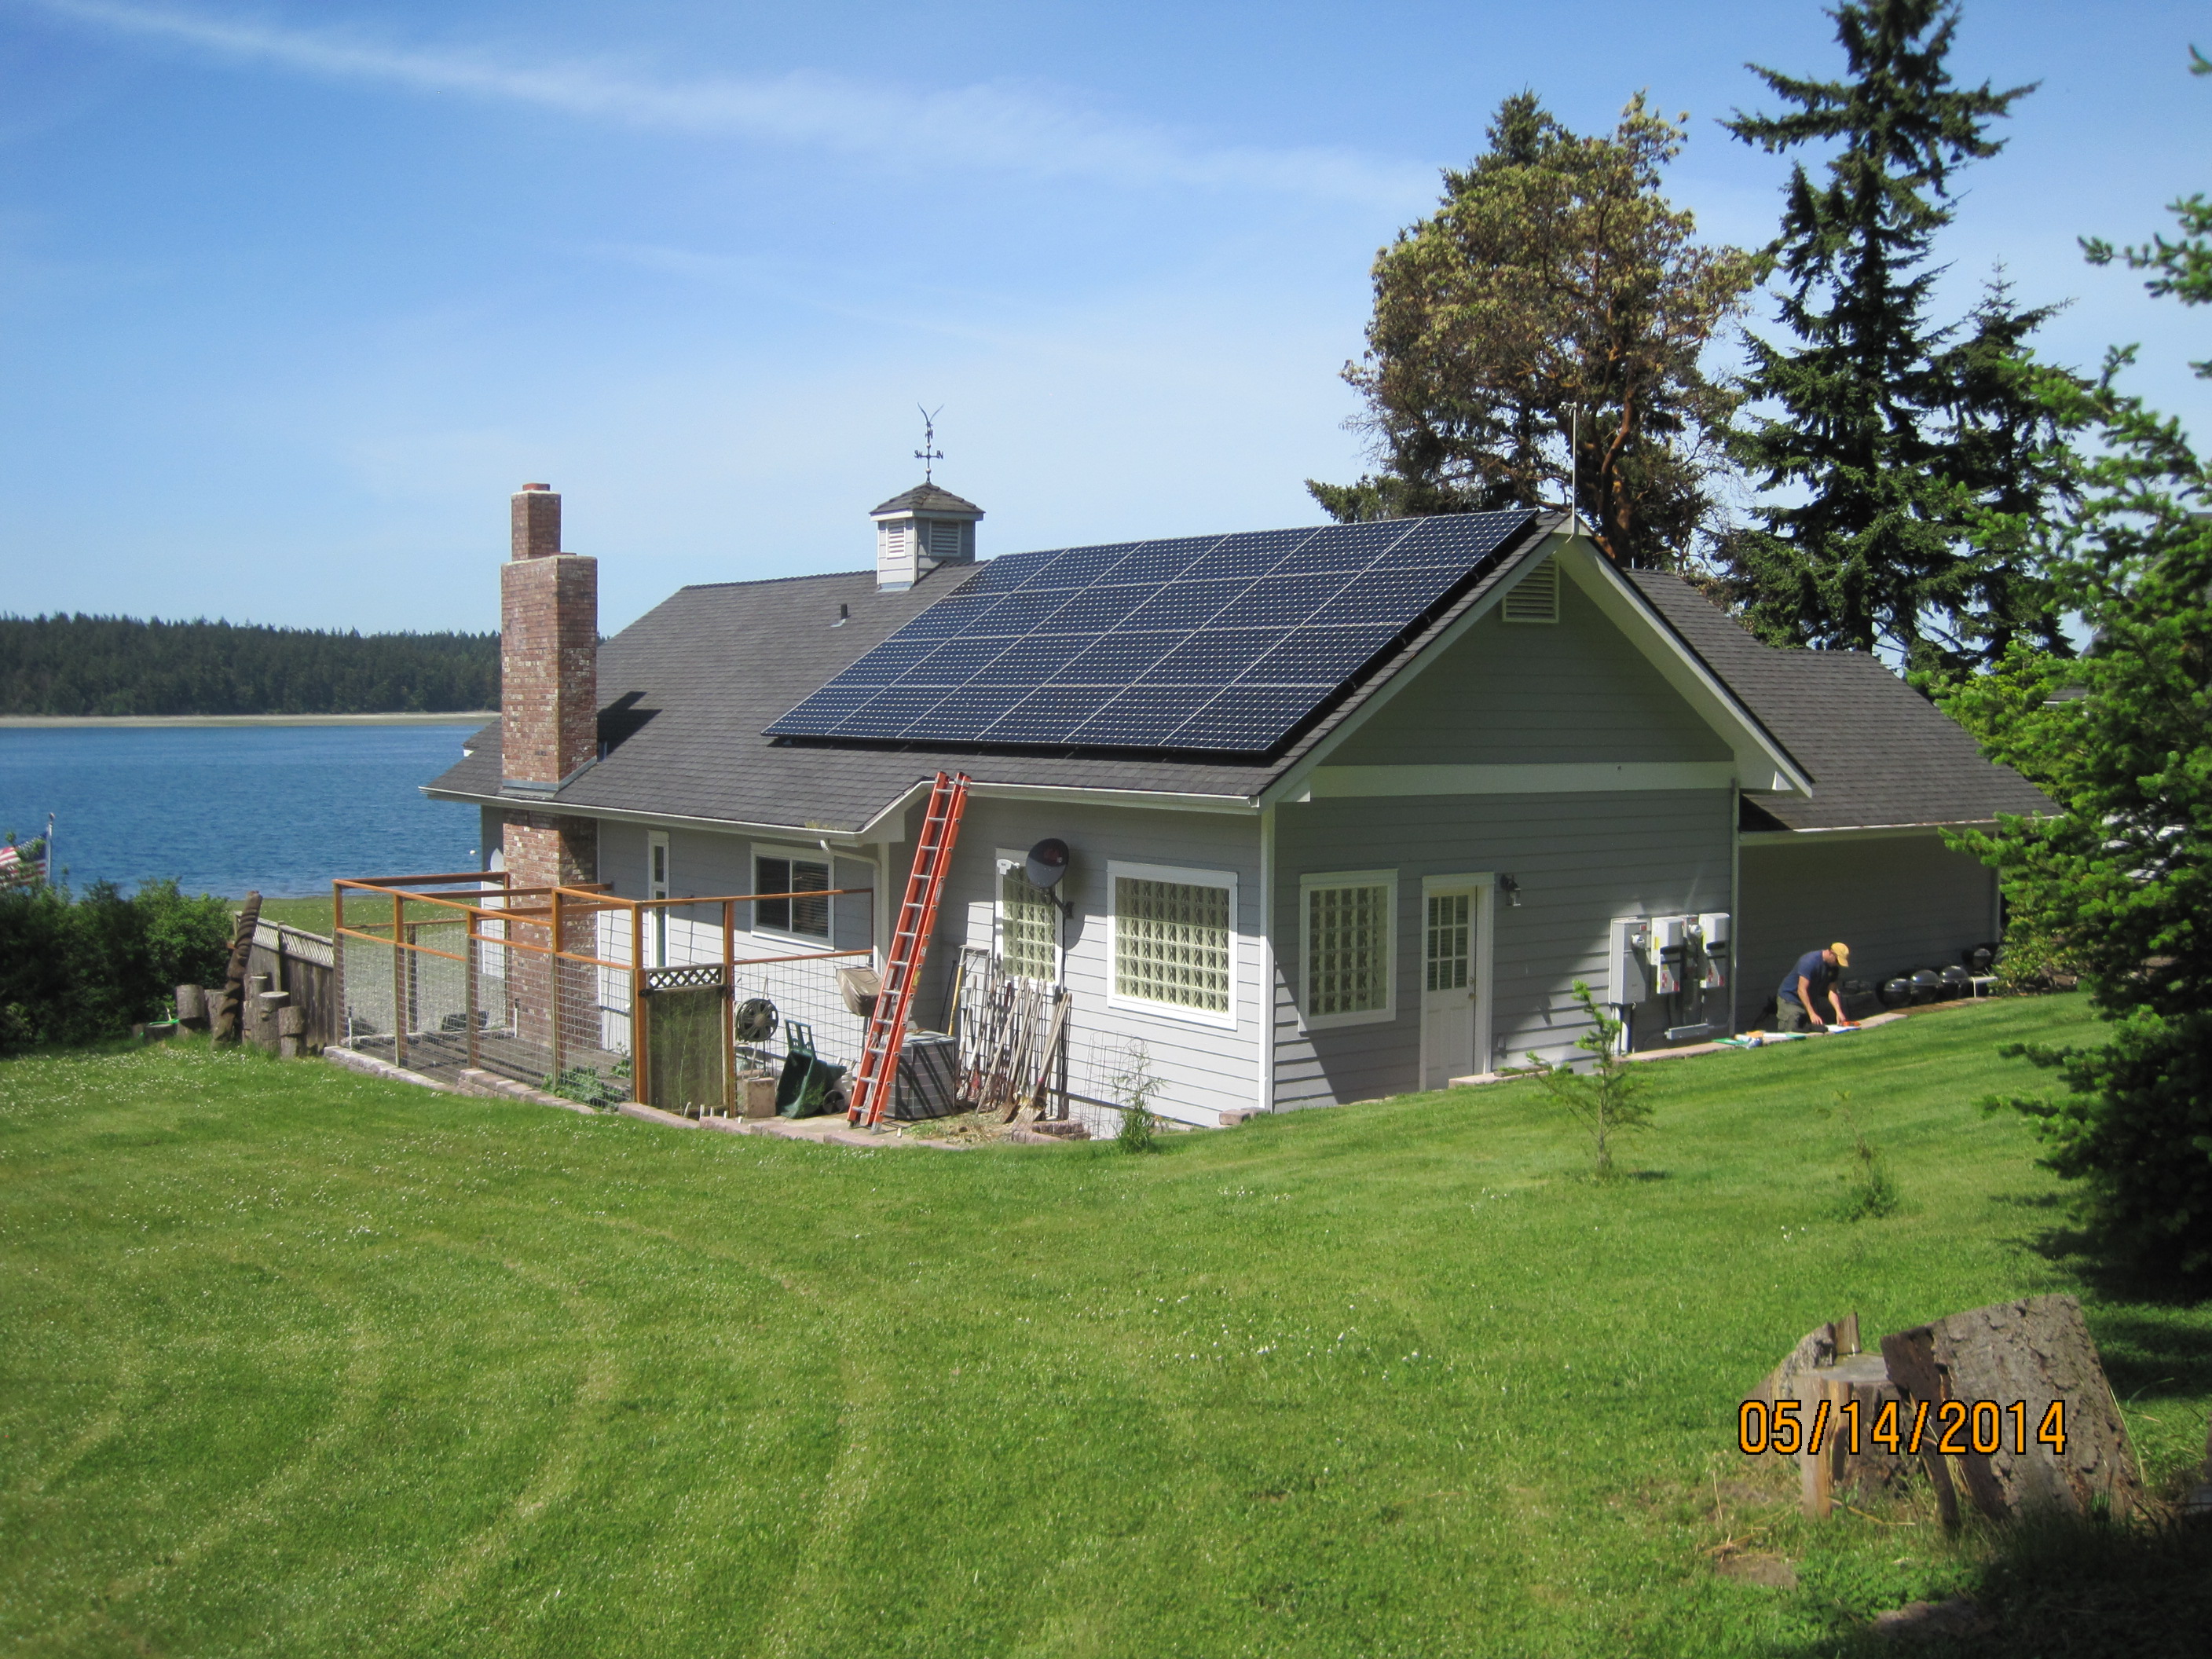
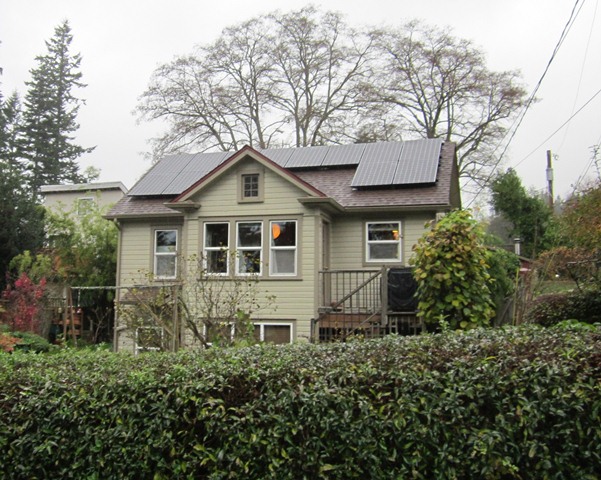
All of our grid-tied pv installations have a production meter which measures the accumulated kwh output from the inverters. This meter reading is the reading to take on June 30. If you have last year’s reading, if you subtract that, the result is this year’s production.
We would LOVE that production figure for our records as well. We have mentioned in the past that we are accumulating data to perform statistical analysis to learn what we can about the various brands of equipment, and the micro-climates within which we work. While we have not been able to complete that study in a scientific manner (the number of variables is challenging) we still want the data for the systems we have installed. Please e-mail your annual production figure, if you have it, to info@powertripenergy.com.

SunPower News
We recently saw a significant price decrease from the leading pv manufacturer SunPower. They have consistently lagged behind other manufacturers with their price decreases and we are glad that this is so. It may sound strange, but we are happy that SunPower is slow to react to market price dops and here is why – in 2013 they were able to generate $221 million in net profits of $2.6 billion revenue. It is of crucial importance for a manufacturer to generate net profits in order to re-invest in research and development and improved operations. Many leading pv manufacturers have struggled to maintain profitability in this very competitive market, especially in the face of continued Chinese dumping.
We also saw another big announcement from SunPower in the second half of last year, and that was the improved warranty. They offer a full 25 year workmanship and repair/replace/reimburse warranty on their modules in addition to the industry-leading 87% power guarantee warranty after 25 years. All of this is very strong, however there is another aspect of SunPower’s operations that make it even stronger. They are currently maintaining a $140 million long term warranty reserve fund. All while only showing 27 failures per 1 million modules shipped.
SunPower continues to charge a premium for their product compared to the myriad of their competitors on the low end. Despite this higher price, for many of our clients, we feel they offer the best long term value because of the quality of the product, the industry-leading efficiency, and the financial health of the corporation. SunPower employs about 1770 US workers among their global workforce of about 6000, and we are happy to be their partners. Good job on the recent price decrease, it will help us install more of these high quality products and make more clean energy.
Electric Site Eval Rig & EV Chargers Springing up in Port Townsend and Silverdale
We now have a new vehicle in the fleet here at Power Trip Energy – an all electric Toyota RAV4 EV. The lease option makes this vehicle very affordable compared to the gasoline we had been burning in our Chevy Astro and Toyota pick-up that had been handling the site eval and light work duties. With the rear seats down, the back is large enough to accomodate a pretty good sized folding ladder for roof access. We have just made a significant reduction the carbon foot-print of our solar installations. Here is Toyota’s site: http://www.toyota.com/rav4ev/
This vehicle made its first run to Bainbridge yesterday and to central Kitsap again last night, totaling 170 miles for the day, taking the opportunity to charge during meals and for two hours in between trips here at our shop. We’ll be posting more reviews of this vehicle as we continue to get to know it.
We made a pleasant discovery last night in Silverdale. There are 4 new EVSE stations going in at the Silverdale YMCA, which is right across the street from the mall and shares a parking lot with the Silverdale Community Center. Two of those are Level II plugs (installation not complete) and two were on a large CHAdeMO kiosk, which was ready, though our Toyota RAV4 EV only has the Level II charge port.
Since this kiosk was not useful to us, we wound up going up the hill to The Doctor’s Clinic at the corner of Mahyer and Ridgetop Rd to use one of the Eaton Level II chargers gratis. Thanks docs!
Usually however we will be charging at the shop, where we have 4 kw of pv that provided 75% of our annual electricity last year. Now that we are charging electric vehicles (ours and anybody else’s, for free), we will be doubling the size of our pv array to cover the additional electrical loads. Believe it or not we still sometimes get asked “Does solar really work in the Pacific Northwest?” Actually yes, it works well enough to power your home and to drive your car with it. That’s the PV – EV connection.

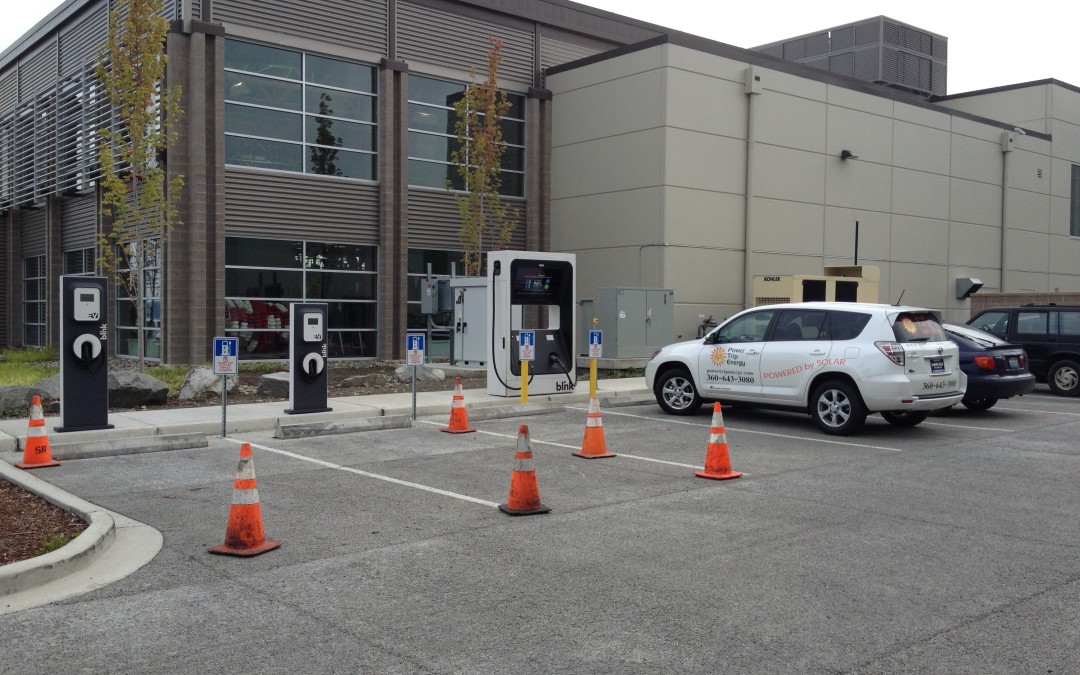
Here’s the RAV4 EV charging under the solar awning on this rainy day.
Plugshare.com is a useful website to locate charging stations near you, let you know if they are free or require payment, and if they are occupied or available. http://www.plugshare.com It is also available as an app for your phone of course.
Random Tesla Encounter
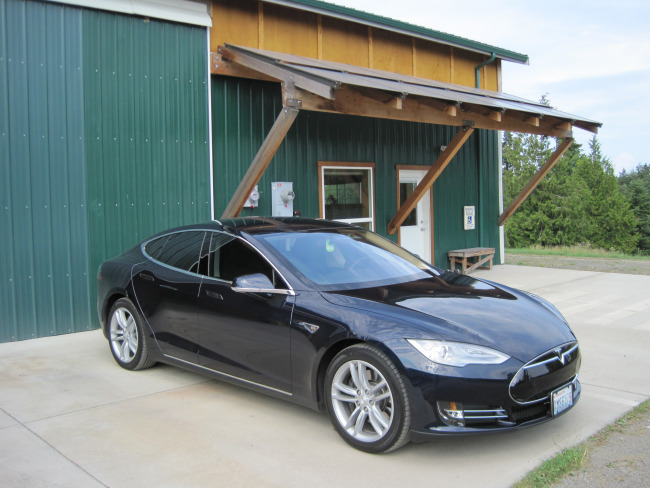
We came back to the office after working in the field this afternoon and drooled over the beauty parked in front of our shop. We thought it was black initially, but actually it was blue. Kind of “Power Trip Energy” blue I think. So proud to be providing clean solar energy to power the car of this unknown person. Free public solar powered EV charging available at our shop, compliments of Power Trip Energy Corp, so please bring your EV here anytime.
Our most-honored company-founding 23 year old Toyota pick-up is parked under the tracker in the background.

I’m not sure how they found us, but it could have been through chargepoint.com , you should check it out to find your recharging stations when on the road.
SunPower Performance Claims & Our Current Data Analysis Project
Here is an interesting video that actually comes off more as a commercial from SunPower, though it is backed up with third party data.
Here is a more direct link to the third-party support for SunPower’s claims:
http://www.photon.info/photon_news_detail_en.photon?id=75152
We are currently undertaking a comprehensive data analysis from as many of our systems as possible from which we can get clean data. At this point with our 340 grid-tied pv systems installed, about 20 use SunPower modules, and they appear to be performing very well although our in-house data analysis is not complete. As we are not a lab, each system has different installation characteristics and is in a slightly different location; our local micro-climates can complicate data comparison. We are working to integrate our performance data onto maps, and compare all other pertinent attributes such as pitch, azimuth, and shading, before making comparisons between manufacturers.
The main reason we have relatively few SunPower installations although we have been installing them for four years now, is that they are more expensive in terms of dollars per watt (in addition to being more efficient in terms of watts per square foot.) As we have not yet been able to quantify this, it has been difficult to justify a higher price for the product without feeling like we can make a substantiated claim for additional energy produced per KW. One of our goals is to see if we can objectively demonstrate more kilowatt hours of energy produced per rated kilowatt of module capacity. If we can do that, then our performance estimates can reflect that data, and the returns will look more attractive for the SunPower modules thereby easily justifying the additional price when our customers are comparing options.
We hope to have our data analysis completed by the end of August this year and will publish results we feel are rock solid.
State Net Metering Caps – By Overall Capacity
A question just came up about how to address potential problems caused by too much solar energy installed on the grid, and the variability in production causing problems for grid operators here in Washington. I think this is a problem we are very unlikely to encounter anytime soon. Here in Washington, in RCW 80.60, our utilities are only required to accept net metering capacity of 0.5% of the 1996 peak load. This seems like a very low cap to me and well under the level that would cause any problems. At what point does that variability cause a problem that would have to be addressed by allowing utilities to “throttle” production through the use of “smart inverters”, or better yet, some short term (day to night) storage of electricity? I don’t know.
I did take a look at yet another state by state comparison of net metering laws (Wikipedia, “Net Metering” article) and have included that table below. I found that many states do not have capacity limits, many states have small caps like ours, and several states have much higher capacity limits, eg VT at 4%, CA, DE, and MO at 5%, and MA at 6%.
I think our state’s low cap will need to be addressed legislatively eventually. That is of course if we all share the goal of increasing the amount of locally owned clean electricity.
| State | Subscriber limit (% of peak) |
Power limit Res/Com(kW) |
Monthly rollover |
Annual compensation |
|---|---|---|---|---|
| Alabama | no limit | 100 | yes, can be indefinitely | varies |
| Alaska | 1.5 | 25 | yes, indefinitely | retail rate |
| Arizona | no limit | 125% of load | yes, avoided-cost at end of billing year | avoided cost |
| Arkansas | no limit | 25/300 | yes, until end of billing year | retail rate |
| California | 5 | 1,000 | yes, can be indefinitely | varies |
| Colorado | no limit | 120% of load or 10/25* | yes, indefinitely | varies* |
| Connecticut | no limit | 2,000 | yes, avoided-cost at end of billing year | retail rate |
| Delaware | 5 | 25/500 or 2,000* | yes, indefinitely | retail rate |
| District of Columbia | no limit | 1,000 | yes, indefinitely | retail rate |
| Florida | no limit | 2,000 | yes, avoided-cost at end of billing year | retail rate |
| Georgia | 0.2 | 10/100 | no | determined rate |
| Hawaii | none [32] | 50 or 100* | yes, until end of billing year | none[33] |
| Idaho | 0.1 | 25 or 25/100* | no | retail rate or avoided-cost* |
| Illinois | 1 | 40 | yes, until end of billing year | retail rate |
| Indiana | 1 | 1000 | yes, indefinitely | retail rate |
| Iowa | no limit | 500 | yes, indefinitely | retail rate |
| Kansas | 1 | 25/200 | yes, until end of billing year | retail rate |
| Kentucky | 1 | 30 | yes, indefinitely | retail rate |
| Louisiana | no limit | 25/300 | yes, indefinitely | avoided cost |
| Maine | no limit | 100 or 660* | yes, until end of billing year | retail rate |
| Maryland | 1500 MW | 2,000 | yes, until end of billing year | retail rate |
| Massachusetts** | 6 peak demand 3 private 3 public |
60, 1,000 or 2,000 | varies | varies |
| Michigan | 0.75 | 150 | yes, indefinitely | partial retail rate |
| Minnesota | no limit | 40 | no | retail rate |
| Mississippi | N/A | N/A | N/A | N/A |
| Missouri | 5 | 100 | yes, until end of billing year | avoided-cost |
| Montana | no limit | 50 | yes, until end of billing year | retail rate |
| Nebraska | 1 | 25 | yes, until end of billing year | avoided-cost |
| Nevada | 1 | 1,000 | yes, indefinitely | retail rate |
| New Hampshire | 1 | 100 | yes, indefinitely | retail rate |
| New Jersey | no limit | previous years consumption | yes, avoided-cost at end of billing year | retail rate |
| New Mexico | no limit | 80,000 | if under $50 | avoided-cost |
| New York | 1 or 0.3 (wind) | 10 to 2,000 or peak load | varies | avoided-cost or retail rate |
| North Carolina | no limit | 1000 | yes, until summer billing season | retail rate |
| North Dakota | no limit | 100 | no | avoided-cost |
| Ohio | no limit | no explicit limit | yes, until end of billing year | generation rate |
| Oklahoma | no limit | 100 or 25,000/year | no | avoided-cost, but utility not required to purchase |
| Oregon | 0.5 or no limit* | 10/25 or 25/2,000* | yes, until end of billing year* | varies |
| Pennsylvania | no limit | 50/3,000 or 5,000 | yes, “price-to-compare” at end of billing year | retail rate |
| Rhode Island | 2 | 1,650 for most, 2250 or 3500* | optional | slightly less than retail rate |
| South Carolina | 0.2 | 20/100 | yes, until summer billing season | time-of-rate use or less |
| South Dakota | N/A | N/A | N/A | N/A |
| Tennessee | N/A | N/A | N/A | N/A |
| Texas*** | no limit | 20 or 25 | no | varies |
| Utah | varies* | 25/2,000 or 10* | varies* | avoided-cost or retail rate* |
| Vermont | 4 | 250 | yes, accumulated up to 12 months, rolling | retail rate |
| Virginia | 1 | 10/500 | yes, avoided-cost option at end of billing year | retail rate |
| Washington | 0.25 | 100 | yes, until end of billing year | retail rate |
| West Virginia | 0.1 | 25 | yes, up to twelve months | retail rate |
| Wisconsin | no limit | 20 | no | retail rate for renewables, avoided-cost for non-renewables |
| Wyoming | no limit | 25 | yes, avoided-cost at end of billing year | retail rate |
Barclays Downgrades Utility Bonds – Incorporates Distributed Solar Progress into Utility Bond Ratings
Barclays downgrades utilities that are not reacting well to distributed renewable energy. When the world changes around you, lack of ability to change yourself leads to negative outcomes. Times of change are also times of great opportunity for those that can be flexible and creative. How will our local utilities fare?
http://blogs.barrons.com/incomeinvesting/2014/05/23/barclays-downgrades-electric-utility-bonds-sees-viable-solar-competition/

George Meyer RIP – Washington Solar Champion
It is a sad day for those of us who have been involved with Solar Washington as we found out we lost a longtime friend and solar advocate.
George Meyer was reliable, kind, and generous with his time and energy, often asking nothing in return. He especially went above and beyond the call of duty to organize the webpage, listings and maps for the state’s Solar Tour. He maintained a positive and cheerful attitude exhibiting grace under pressure.
George passed away April 24. Our thoughts are with his family, and he will be greatly missed by all who knew him.
The Coming Utility Transformation – Efficiency, Distributed Generation, and Storage
Scott Sklar can write a great essay. In this essay he cites the overwhelming belief by utility execs that their business models will be significantly changed in the next decade and a half. He also ties threads together using the evidence of opportunities for increased energy efficiency developments in building, the wildfire pace of deployment of renewable energy at the site of consumption as distributed generation, and the coming wave of distributed energy storage. Mr. Sklar’s essay puts into words some of our aspirations here at Power Trip Energy, and we are gratified to see these trends.
There is a major trend that is not mentioned in this essay which utilities should view as their best coming opportunity, and that is the electrification of our transportation system.
His summarizes well when he states that regulators are becoming aware that the market is already out of their control, as the utility sector tries to navigate the rapidly changing world.
Utility Nightmares: Distributed Generation and Halving Electricity Consumption